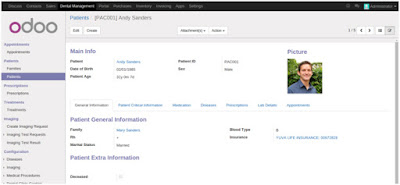
1. Detailed Patient record.
Jmeter installation on Linux platform on ubuntu operating system.a)- Run the below command on terminal for install Jmeter OR you can download the latest jmeter version and installed as below steps.
- 1-itadmin@IT:~$ sudo apt-get install jmeter
- http://www.gtlib.gatech.edu/pub/apache//jmeter/binaries/itadmin@IT:~$ sudo wget
http://www.gtlib.gatech.edu/pub/apache//jmeter/binaries/apache-jmeter-2.13.tgz
itadmin@IT:~$ cd apache-jmeter-2.13
itadmin@IT:~/Downloads/apache-jmeter-2.13/bin$ ./jmeter.sh
After Installation open the Jmeter Like the below image.
Jmeter Configurations for the Odoo Load testing.
a)- Right click on test plan -> Add > Thereads(users) -> Theread GroupName:-Thread Group (Default) As you like and understand,can change the Name
comments:
This is Sampler action options:-
Continue, Start next, Thread Loop, Stop Thread, Stop Test, Stop Test Now
Thread Properties:
Number of Threads(Users):- 1 (default) you can put numbers of users.Which will be he send the apache requests on odoo server. keep it 100
Ramp-Up period(in seconds): 1 (default) Send apache request every second
Loop Count:- 1 (Default) Send apache request on odoo server as per loop 1,2..
Delay Thread creation until needed:- No Need
Scheduler:- No Need
b)- Right click on Thread Group -> Add > Sampler -> HTTP Request
Name: HTTP Request (Default) you can putt the Odoo-Http-Request
Comments:
Server Name od IP:- 52.91.247.154 ( odoo server ip)
Path:- / (This is linux root directory and set the path for the thread will access the under the /our server.)
Note - Other field is no need to configure.
c)- Right click on test plan -> Add -> Listener -> View Results Tree
ubuntu@ip-172-31-32-56:~$ sudo tail -f /var/log/odoo/odoo-server.log
2016-02-10 13:55:03,317 23853 INFO iPaas_Odoo9
werkzeug: 127.0.0.1 - - [10/Feb/2016 13:55:03] "GET / HTTP/1.1" 200 -
2016-02-10 13:55:03,355 23853 INFO iPaas_Odoo9 werkzeug:
127.0.0.1 - - [10/Feb/2016 13:55:03] "GET / HTTP/1.1" 200 -
2016-02-10 13:55:03,368 23853 INFO iPaas_Odoo9 werkzeug:
127.0.0.1 - - [10/Feb/2016 13:55:03] "GET / HTTP/1.1" 200 -
2016-02-10 13:55:03,381 23853 INFO iPaas_Odoo9 werkzeug:
127.0.0.1 - - [10/Feb/2016 13:55:03] "GET / HTTP/1.1" 200 -
D)- Right click on test plan -> Add -> Listener -> aggregate graph
Samples is the number of samples with the same label.
Average is the average time of a set of results.
Median is a number which divides the samples into two equal halves. Half of the samples are smaller than the median, and half are larger. [Some samples may equal the median.] This is a standard statistical measure. The Median is the same as the 50th Percentile.
90% Line
Min is the shortest time for the samples with the same label
Max is the longest time for the samples with the same label
Error % is the percent of requests with errors
Throughput is measured in requests per second/minute/hour. The time unit is chosen so that the displayed rate is at least 1.0. When the throughput is saved to a CSV file, it is expressed in requests/second, i.e. 30.0 requests/minute is saved as 0.5.
Kb/sec - throughput measured in Kilobytes per second. Time is in milliseconds.
Run Jmeter Configurations:-
Step-1
Save The file choose the location
Step-2
Step-3
Step-4
Aggregate Graph Report
Note- Successful jmeter send apache request om Odoo server Check result and Right Uper coner “0” Yellow Field and 0/100 success Green


